IDENTIFYING A GOOD BASELINE FOR A “GOOD” RETURN
If you look up a corporate bond or index fund, you can see the expected return summed up nice and neat like a menu. What is it for a comic book? You’ll often get someone saying that CGC 9.8 did this and CGC 9.6 did that… it was a positive number or it was a negative number. If a carefully selected and heavily talked about book went up +20% YTD, sure that’s a nice big green number, but is it still as nice if the rest of the comic book market went up +30%? With “inflation” being the hot vocabulary word of the last few months, it’s almost harder to not find something that has gone up.
So what do you do? Even if you do a simple comparison of one book to another similar book, you’re headed towards a more informed picture, but it’s far too easy to cherry-pick an underperforming book to make another appear better. Let’s go a bit further here. Comic book indexes.
There are many ways to group books together: By publisher, age, hero/villain, small-cap, large-cap, genre, randomly… the sky’s the limit. For the purposes of an initial exploration here, we’ll just take a quick look at the Silver Age. A few popular ones to keep it interesting, and just ten books for now due to the amount of time needed to collect the data. And yes, you’d want to adjust the number of books and the specific titles to gain a more accurate picture for the specific filters you’re looking for… so it is definitely encouraged to login into GoCollect and assemble your own.
On to the example…
SILVER AGE INDEX
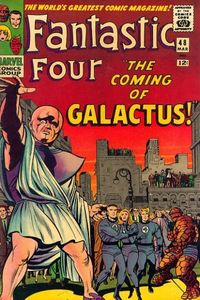
The books included are Fantastic Four #48, X-Men #1, Avengers #1, Batman #181, Detective Comics #359, Daredevil #1, The Brave and the Bold #28, Green Lantern #59, and Fantastic Four #50. Yes, your favorite book was probably left out; but again, it’s just for the sake of example.
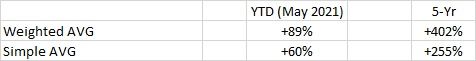
The data used was at rough as close as possible to the 10% mark of the CGC census for each book. At the time of writing this, the data for the month of May is likely incomplete; so the 5-year performance is more reliable. A couple calculations and we find:
 OVERALL
If a specific Silver Age book went up +20% YTD or +200% over the last five years, congratulations to the bookholders. Any gain is a gain. At the same time, not to be too pessimistic, but it did underperform. Simply posting a positive YTD or multi-year return number fails to paint the full picture. If you’re just collecting, it doesn’t matter; but if you’re looking for some form of financial efficiency, yeah, it’d be a good idea to at least identify what a “good” return really is.
Again, lots of nuance and hairsplitting is involved. Even within the example index above, there are noticeable performance differences between publishers, which we will not get into here, but it illustrates the importance of relative comparison. It’ll be hard to come to a consensus on what books to include, but some general indexes would be a very beneficial tool as the comic book market grows.
"I feel the need…the need for speed!" - Maverick